Creating a report takes three steps: selecting geographies, selecting tables, and viewing your results.
Selecting Geographies:
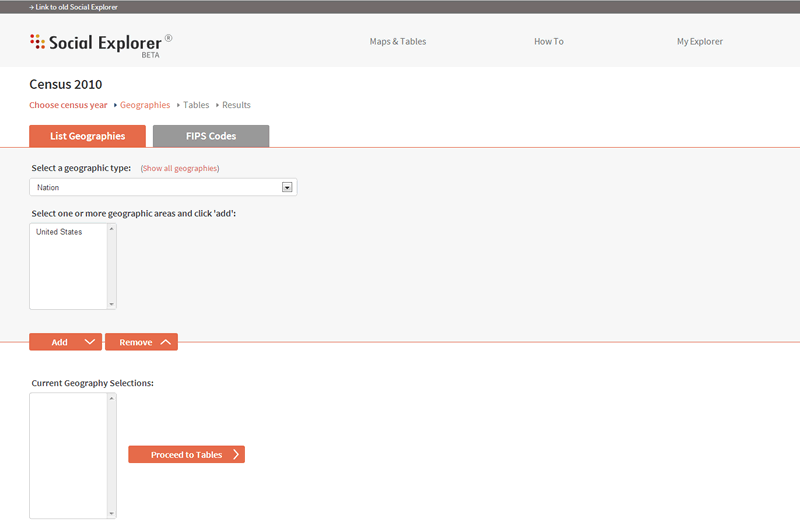
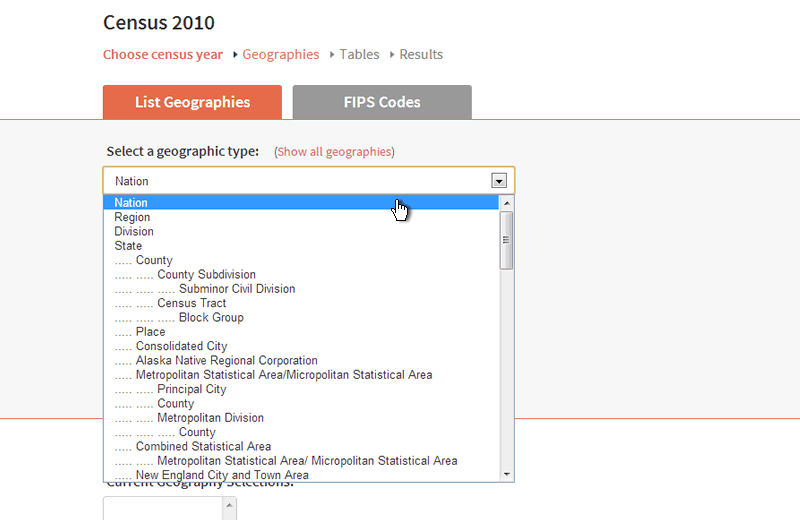
Select the geographies you would like to examine, starting with the list of geography types.
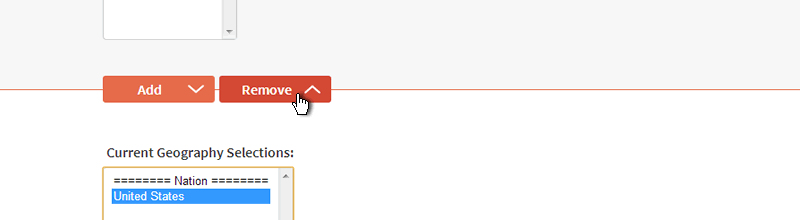
For this example, I started by adding the United States (nation level), by clicking the area name and then the "Add" button. Once added, it appears in the list of "Current Geography Selections".
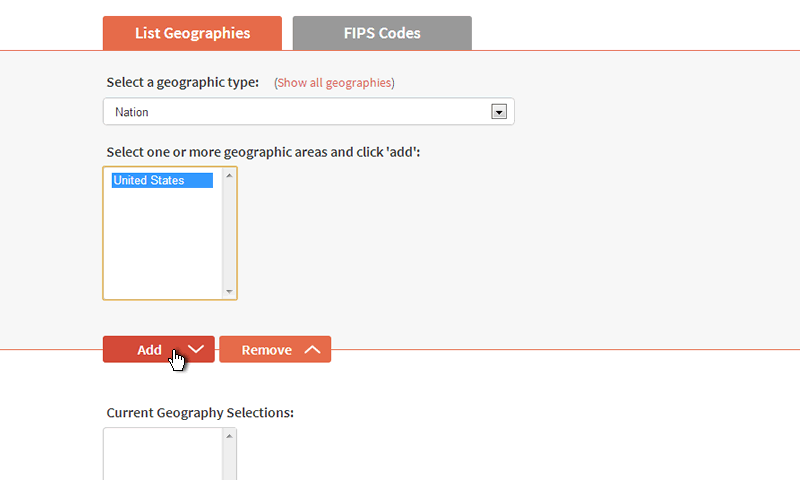
The Remove button subtracts geographies from your list, allowing you to edit your selections.
Adding a Mixture of Geography Types:
You can add a mixture of geography types (such as nation, county, and census tract), all in a single report. Navigate to different geography types by following the prompts. For example, when I select "county," the next menu asks me to select a state (or all counties in the United States). After I select New York, it asks me to pick specific counties (or all counties in New York State).
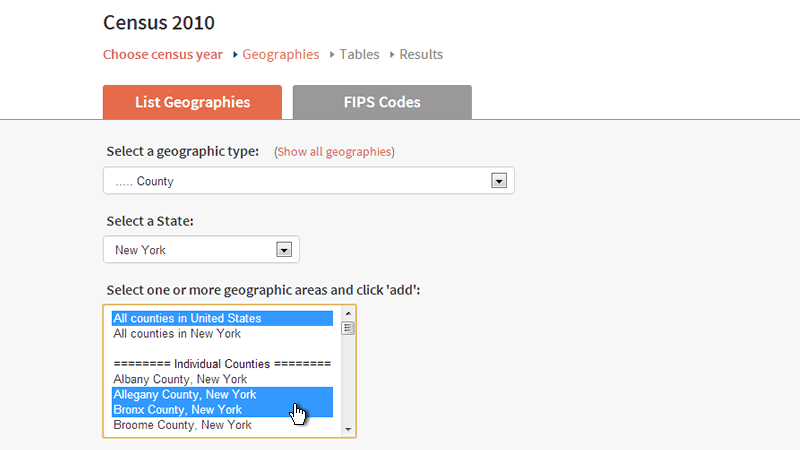
You can select counties (or any geography) individually or in groups using your usual keyboard and mouse shortcuts.
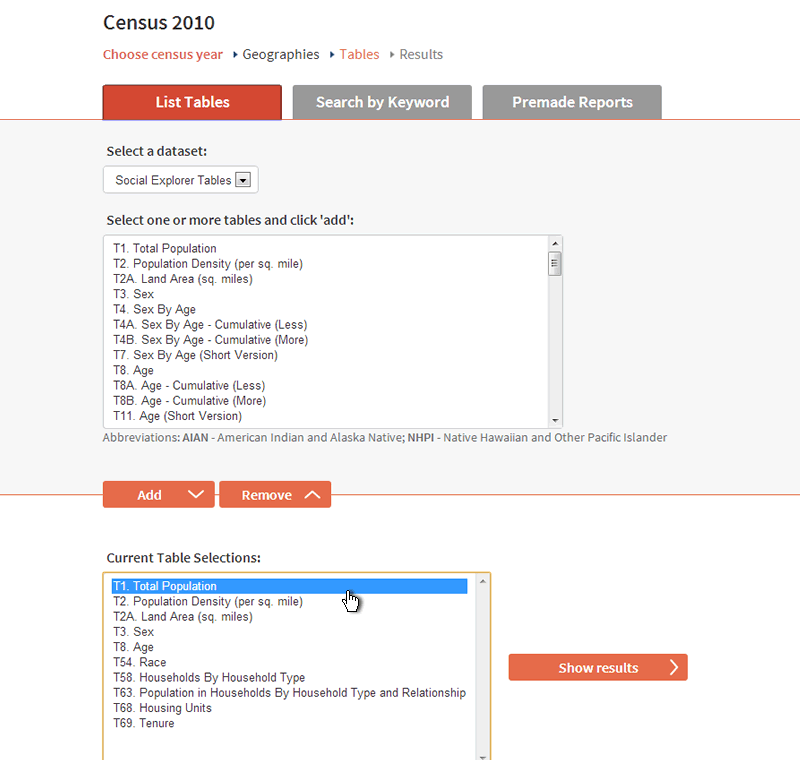
Selecting Tables:
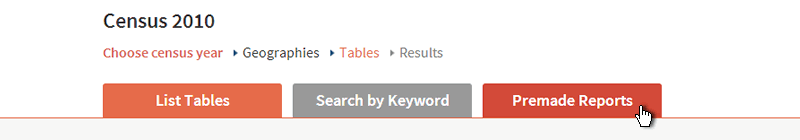
Social Explorer’s many data tables display information for specific variables. This data comes from the Census Bureau and other sources, depending on which survey you are exploring. You can select your tables from the full list, by a keyword search, or through a premade report.
The List Tables and keyword search options allow you to customize your report by selecting the specific tables yourself and browsing all available tables.
Premade reports are made from pre-selected tables that relate to a particular topic. These are a great way to get started, and then you may then also add or subtract specific tables from the premade table list.
For example, if you select the "Essentials - Demographic Report" from the premade options:
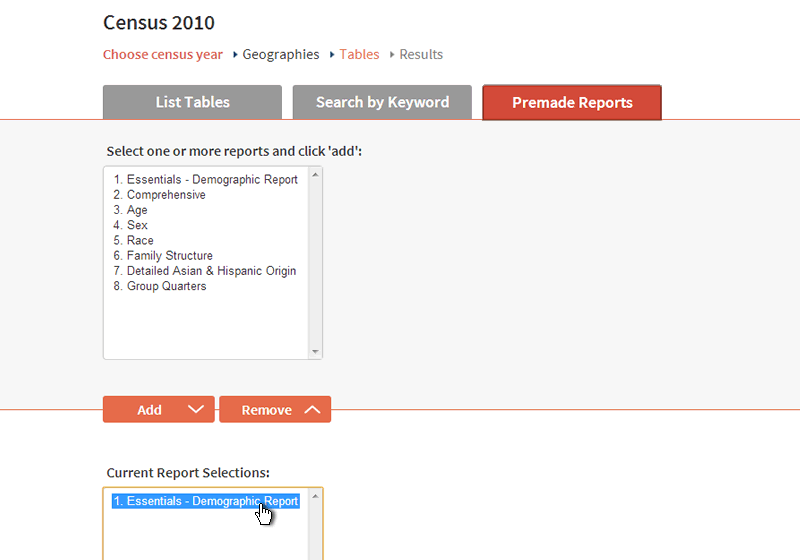
Then you can toggle back to List Tables to see exactly which tables are included, and if you want to make any edits.
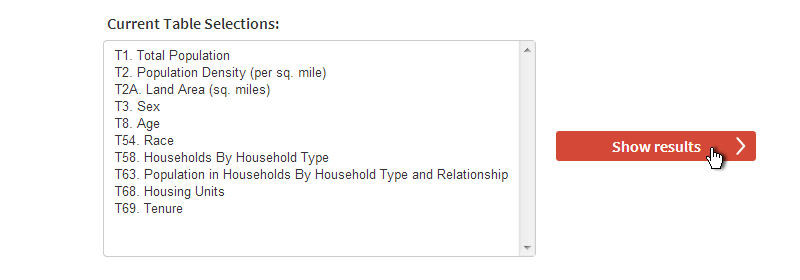
Show Results:
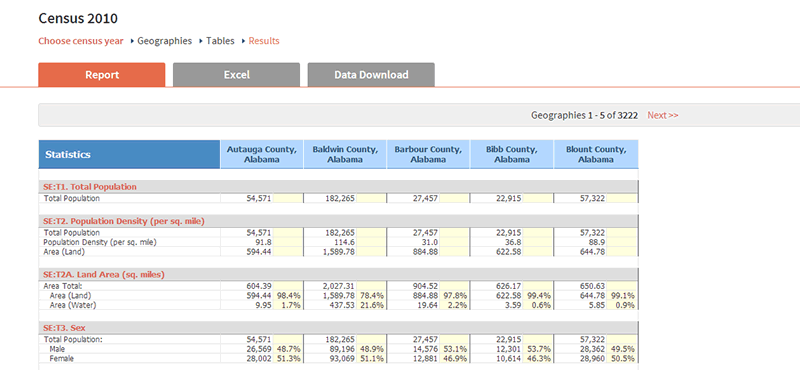
After picking your tables, click the "Show results" button to view your report.
This will create your report:
Modifying Reports:
You can move ahead or back at any point in the report-making process. The status bar at the top shows which step you are on.

Click any of the terms ("Geographies," "Tables," or "Results") to get back to a prior step and make any necessary edits.
For more information on any variable, click on the table title. A new window will launch with documentation about the survey featured in the report. It displays the specific tables where this data comes from, how the data was calculated, and explanations of data and terminology from the Census Bureau. This information will also show you the methodology behind the numbers. This documentation is also useful as a reference and for help with citations.