
Custom Colors:
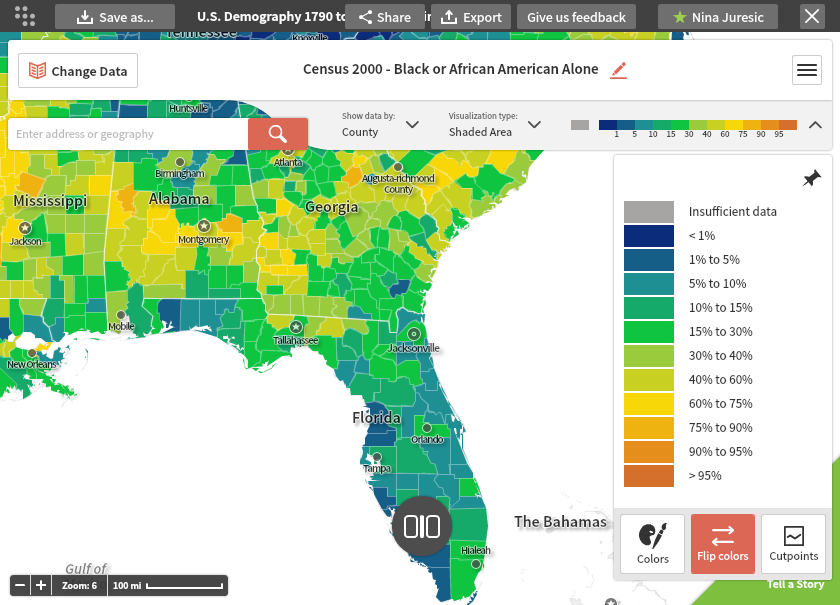
Social Explorer orange is the default color scheme for all shaded maps. You can also select from custom color options to personalize your map. Click on the colors button below the map legend and choose from our menu of color spectrums.
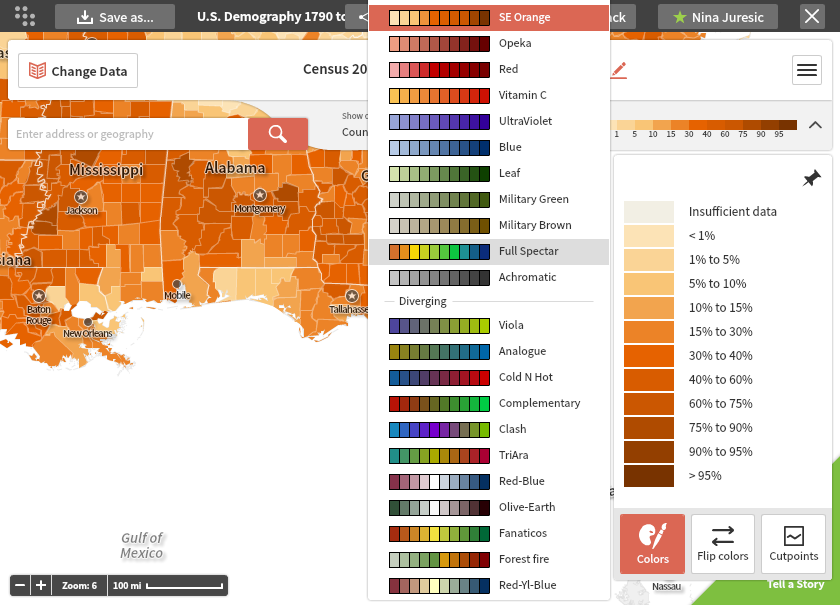
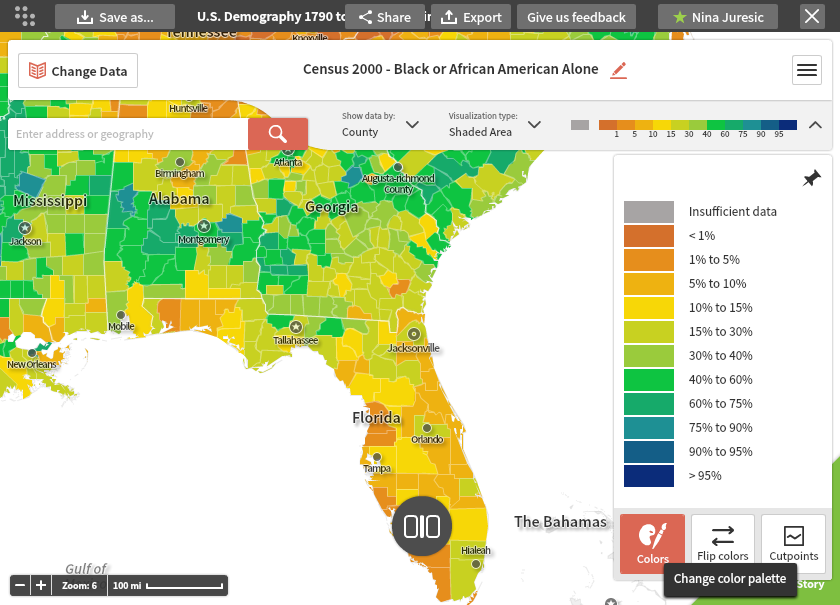
You can also reverse the order of the colors by clicking on the "Flip colors" button. Here we selected and then reversed the "full spectar" color scheme.
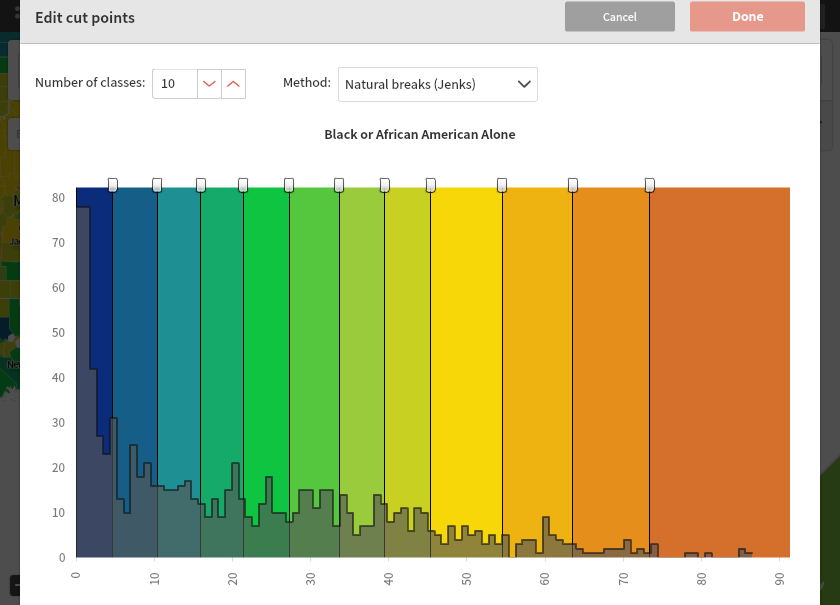
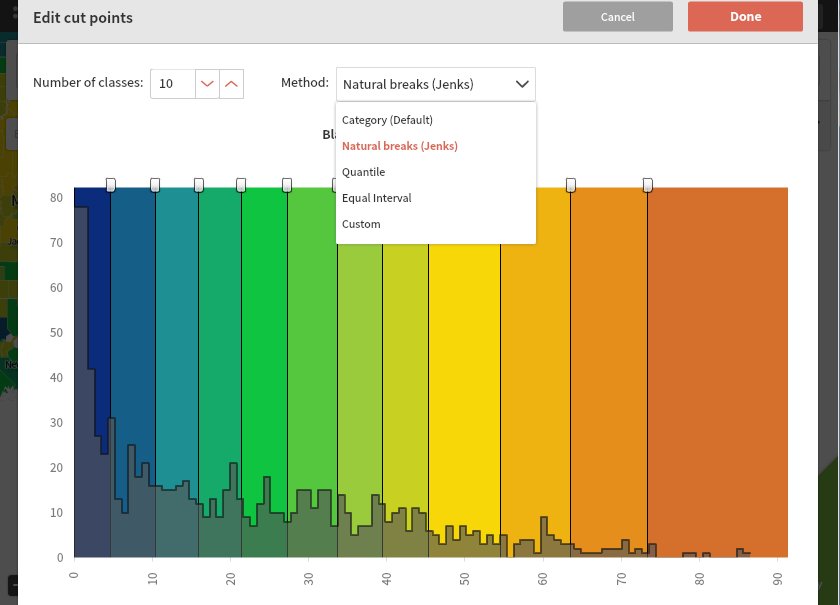
Custom Cut Points:
The default shaded area map displays cut points are determined by the data table behind it. These breaks are viewable in the legend. You can also switch Cut Point types and the number of classes (for example having data cut into five groupings, or ten groupings for more detail). Click on the "Cutpoints" button and select the number of classes and method of calculation you want. You can also manually drag the markers to adjust the breaks. (This tool is especially helpful for mapping variables with very low numbers/percentages so they are more visible.)