

Once you have created your report, you can now change the way it displays.
Viewing Columns and Rows:
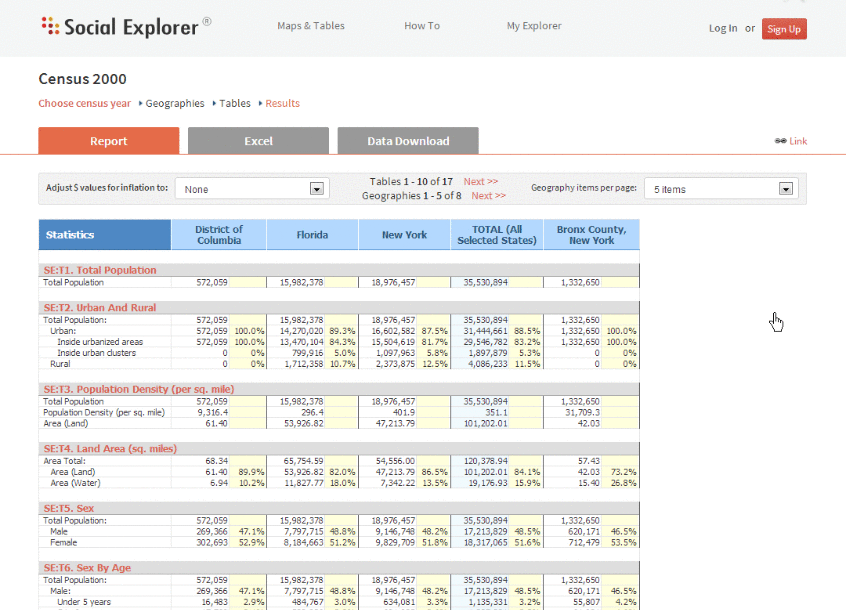
After creating your report, whether from the tables tab or from a map, you will get an on-screen version of it like this: 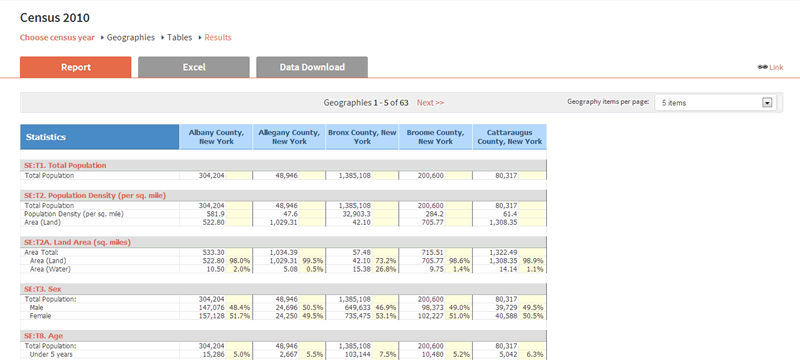
If you have selected multiple tables, they may not all fit onto the screen. To view the next set of tables, simply click the "next" arrows. 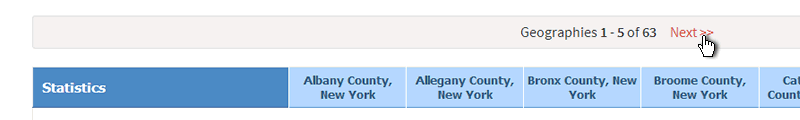
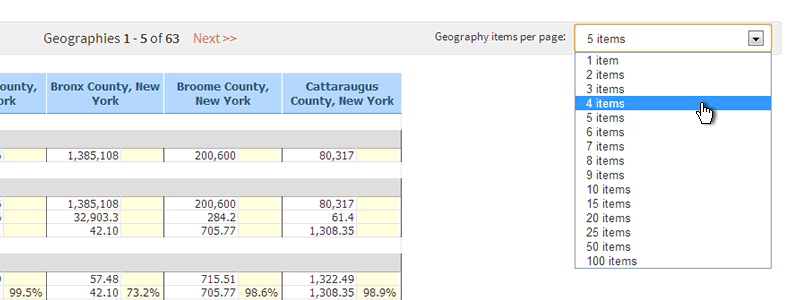
Depending on how many geographies you selected, they may not all fit onto the default screen. You can view the rest by clicking on the "next" arrows. Or, you can increase the number of geography columns displayed per page.