After exploring the maps, you may wish to create a report to get the specific data for different geographies and variables. Building on the lessons from creating a map, these instructions will show you how to create a report from the map dashboard.
(For more on creating and customizing maps, please visit the map basics instructions.)
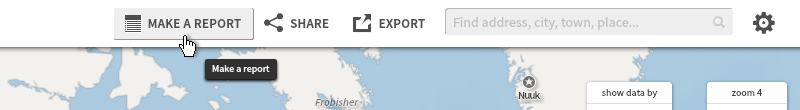
Launching the Report Wizard:
The Make a Report button will launch an easy wizard to help you create your report without leaving the map dashboard. Click the button, located on the top right, to get started.
Selecting a Survey:
After clicking the Make a Report button, the wizard will prompt you to make three selections. First, pick the survey you wish to examine.
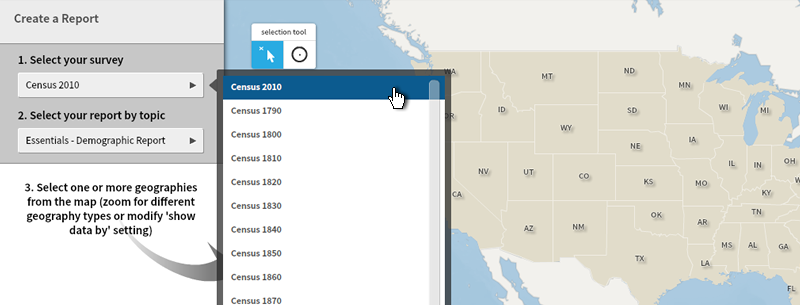
Whichever survey you were most recently exploring on the map will be the default, or you may switch to any other survey in the dropdown list.
Selecting a Report:
Next, the wizard will prompt you to select a report type. The list of premade reports help group variables.
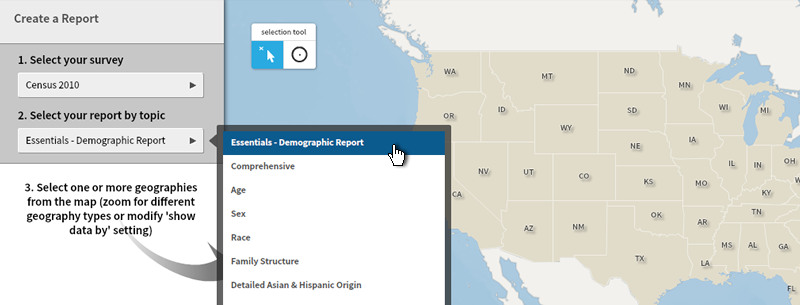
Choose the "essentials" or "comprehensive" report for an overview, or a topical report, such as "age" or "race."
Selecting Geographies:
Then, select the geographies you wish to examine. You can do this by clicking on them using the "points" method, or by the "circle" method.
In this screen, I used the points method (the default) to click on three states--shaded in gray and listed at the left.
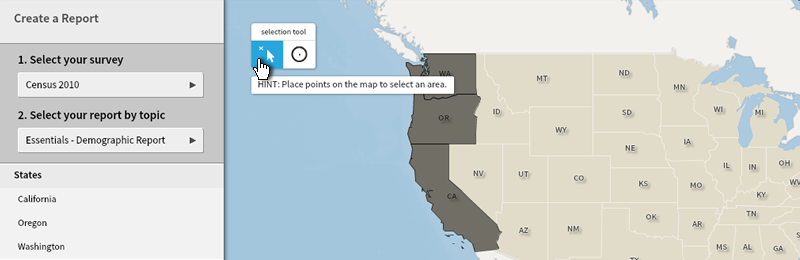
To remove a geography from the list, simply click on it again.
Using the "circle" method, you can select regions of the map quickly. In this screen, I clicked and dragged my mouse to create a circle in the west.
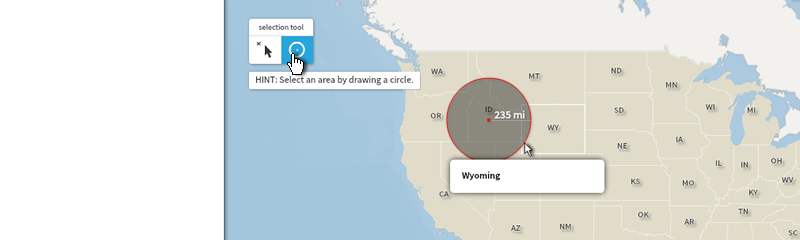
This way, I selected all states enclosed or overlapping the circle.
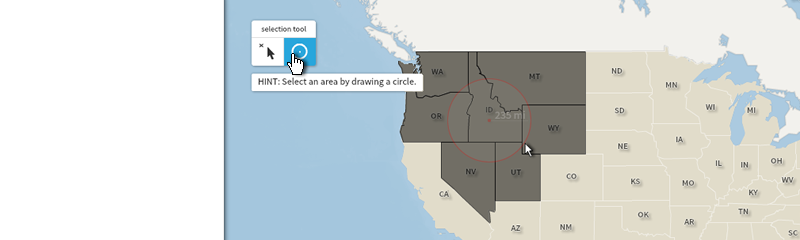
If needed, you can also switch back to the points method to remove states one at a time from the list.
Also, clicking on "Reset" will clear all selections (survey, report, and geography) if you need to start over.

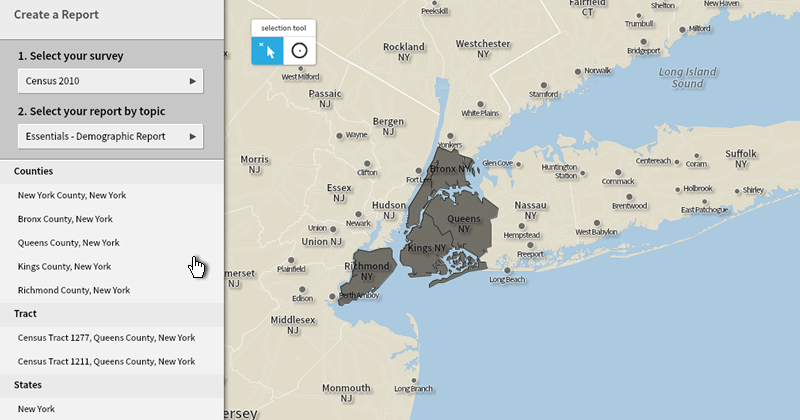
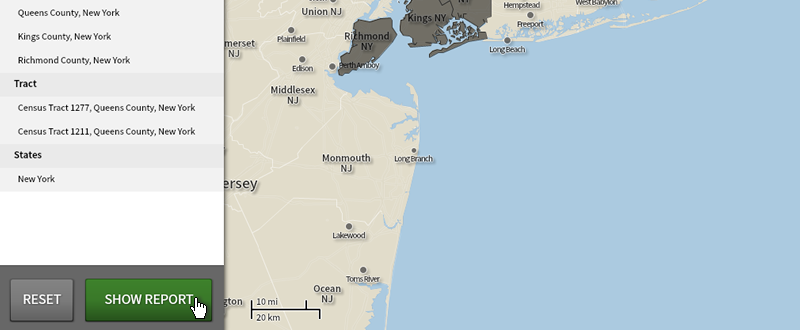
Selecting Detailed Geographies:
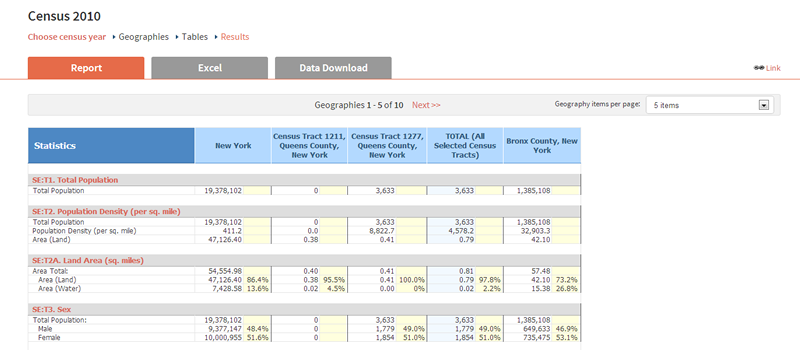
You can select geographies from different levels in a single report. For example, in this screen, I used the zoom and geography level tools to select New York State, the five counties of New York City, and two census tracts in Queens. (For more on the zoom and geography level controls, please see the map basics instructions.)
Also, keep in mind that you will be able to edit your data and geography selections after creating your report. You can also hit the "Cancel Report" button at any time.
Show Report:
Once done customizing your survey, report type, and geographies, click on the "Show Report" button.
A new window will open displaying your report.